Can TornadoVM run Matrix Multiply faster than OpenCL Native?
Published:

TornadoVM, a Java parallel programming framework to run on hardware accelerators, can sometimes outperform OpenCL code on GPUs, despite the latter being closer to the hardware. This is possible due to the TornadoVM’s ability to automatically apply compiler and runtime optimizations.
In this article, we are going to explore and analyse the different optimizations that are applied in TornadoVM using the Matrix Multiplication application as an example. Furthermore, we are going to build an OpenCL C++ application from scratch to replicate, step by step, all compiler and runtime optimizations that TornadoVM automatically applies.
Java Baseline
Since applications written for TornadoVM are minimally extended from the Java version, let’s start with the Java sequential code. You can find all Java examples used in this post in the following GitHub repository:
https://github.com/jjfumero/tornadovm-examples
The Java sequential code is described as follows:
public static void mxmSequential(FloatMatrix a, FloatMatrix b, FloatMatrix c) {
   for (int i = 0; i < a.M(); i++) {
       for (int j = 0; j < b.N(); j++) {
           float acc = 0;
           for (int k = 0; k < c.M(); k++) {
               acc += a.get(i, k) * b.get(k, j);
           }
           c.set(i, j, acc);
       }
   }
}
The code shows the canonical O(n3) matrix multiplication. FloatMatrix is a custom data type, and it uses a Java memory segment to store the data in 1D format. For simplicity, we are going to run squared-matrices, and for our experiments, we choose matrices of 1024x1024 elements.
The FloatMatrix type is defined as follows:
private static class FloatMatrix {

   private static final int FLOAT_SIZE = 4;

   private final int m;
   private final int n;
   private final MemorySegment segment;

   public FloatMatrix(int m, int n) {
       this.m = m;
       this.n = n;
       final long segmentByteSize = n * m * FLOAT_SIZE;
       segment = Arena.ofAuto().allocate(segmentByteSize, 64);
   }

   public void set(int i, int j, float value) {
       final int index = i * m + j;
       segment.set(JAVA_FLOAT, index * FLOAT_SIZE, value);
   }

   public float get(int i, int j) {
       final int index = i * m + j;
       return segment.get(JAVA_FLOAT, index * FLOAT_SIZE);
   }

   public void initRamdom() {
       Random r = new Random(71);
       for (int i = 0; i < m; i++) {
           for (int j = 0; j < n; j++) {
               set(i, j, r.nextFloat());
           }
       }
   }

   public int M() {
       return m;
   }

   public int N() {
       return n;
   }
}
Hardware and Software Setup
So, how fast is this implementation? To talk about performance, we need to discuss the environment and machine in which this application runs on. We are going to use an on-premise server with an Intel i9-13900K CPU on a system with 64GB of RAM. The JDK used is OpenJDK 21.0.4 that runs on top of an Ubuntu 22.04.4 LTS OS using the Linux 6.8.0-47 kernel. In a nutshell:
Hardware:
- CPU: 13th Gen Intel(R) Core(TM) i9-13900K
- GPU: RTX 4090
- RAM: 64GB
Software:
- OS: Ubuntu 22.04.5 LTS
- Kernel: Linux
6.8.0-47-generic#47~22.04.1-Ubuntu - NVIDIA-DRIVER: 550.107.02
- CUDA:
cuda_12.1.r12.1/compiler.32688072_0 - GCC: gcc (Ubuntu 11.4.0-1ubuntu1~22.04) 11.4.0
- TornadoVM: 1.0.9-dev (
1f0dba4) using the OpenCL Backend. - JDK: OpenJDK “21.0.4” 2024-07-16 LTS
Application:
- Matrix Multiplication in FP32
- Matrix Size: 1024x1024 elements.
- Link
Performance of Java Sequential Code
The example provided on GitHub contains the instructions to run all benchmarks:
$ export CLASSPATH=target/tornadovm-examples-1.0-SNAPSHOT.jar:$CLASSPATH
$ tornado io.github.jjfumero.MatrixMultiplication jmh
If using JMH for micro-benchmarking, we get the following results (showing only the Java sequential implementation):
Benchmark                                                  Mode  Cnt           Score          Error  Units
MatrixMultiplication.Benchmarking.mxmSequential            avgt    5  2113164943.347 ± 17774213.889  ns/op
This is 2.1 seconds. Now, let’s run the Java multi-core implementation using the Java Vector API and analyse how fast we can get with Java parallel code on this hardware.
Java Vectorized Parallel Code
Here’s the multi-threaded and vectorized implementation. To make this work, matrix b needs to be transposed before invoking this method. As we can see, Java streams parallelize the outer loops, and the Java Vector API handles the reduction part of the kernel.
public static void mxmParallelVectorized(FloatMatrix a, FloatMatrix b, FloatMatrix c) {
   VectorSpecies<Float> species = FloatVector.SPECIES_PREFERRED;
   IntStream.range(0, a.M()).parallel().forEach(i -> IntStream.range(0, b.N()).parallel().forEach(j -> {
           float acc = 0;
           for (int k = 0; k < c.M(); k += species.length()) {
               FloatVector vector1 = FloatVector.fromMemorySegment(species, a.segment, (i * a.M() + k) * FLOAT_BYTES, ByteOrder.nativeOrder());
               FloatVector vector2 = FloatVector.fromMemorySegment(species, b.segment, (j * b.N() + k) * FLOAT_BYTES, ByteOrder.nativeOrder());
               acc += vector1.mul(vector2).reduceLanes(VectorOperators.ADD);
           }
           c.set(i, j, acc);
       }));
}
When we run this version with JMH, we obtain the following timers:
Benchmark                                                  Mode  Cnt           Score          Error  Units
MatrixMultiplication.Benchmarking.mxmParallelVectorized    avgt    5    13586191.583 ±    78030.170  ns/op
MatrixMultiplication.Benchmarking.mxmSequential            avgt    5  2113164943.347 ± 17774213.889  ns/op
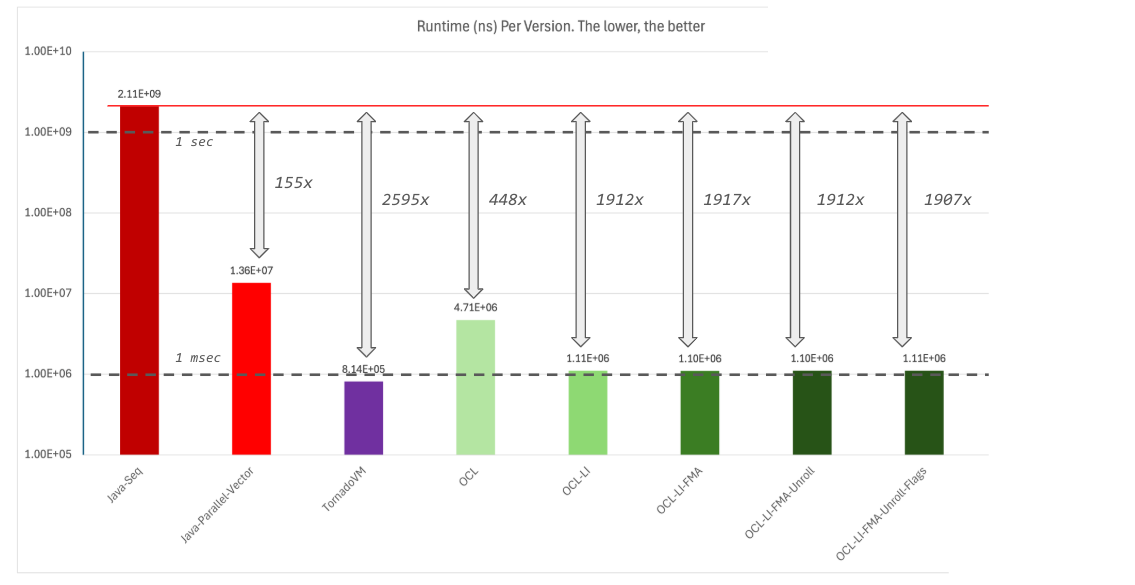
The Java multi-core version that is parallelized with Java streams and the Vector API runs under 14 ms. This is 155x faster than the sequential implementation.
The CPU’s performance using the Vector API is quite impressive. The CPU has 8 performance cores (P-Cores) with Hyper-Threading support, enabling 16 threads with AVX2 instructions (processing up to 8 FP32 values per instruction). Additionally, there are 16 e-cores (energy efficiency cores) with AVX2 support, running at a lower frequency.
Running on the GPU RTX 4090 with TornadoVM
Next, we are going to implement the matrix multiplication Java program to use the TornadoVM parallel programming framework and automatically run on the NVIDIA RTX 4090 GPU.
private static void mxmTornadoVM(Matrix2DFloat a, Matrix2DFloat b, Matrix2DFloat c, final int size) {
   for (@Parallel int i = 0; i < size; i++) {
       for (@Parallel int j = 0; j < size; j++) {
           float sum = 0.0f;
           for (int k = 0; k < size; k++) {
               sum += a.get(i, k) * b.get(k, j);
           }
           c.set(i, j, sum);
       }
   }
}


private static TornadoExecutionPlan createTornadoVMPlan(Matrix2DFloat a, Matrix2DFloat b, Matrix2DFloat c) {
   TaskGraph taskGraph = new TaskGraph("mxm");
   taskGraph.transferToDevice(DataTransferMode.FIRST_EXECUTION, a, b) //
           .task("mxm", Multiplication::mxmTornadoVM, a, b, c, a.getNumRows()) //
           .transferToHost(DataTransferMode.EVERY_EXECUTION, c);
   TornadoExecutionPlan executionPlan = new TornadoExecutionPlan(taskGraph.snapshot());
   executionPlan.withWarmUp().withDevice(TornadoExecutionPlan.getDevice(0, 0));
   return executionPlan;
}
We are not going to explain the TornadoVM parallel programming model in this post. However, it is worth mentioning that the Java code that is parallelized with TornadoVM is implemented using the naive sequential matrix multiplication.
Furthermore, note that we have not specified any low-level optimization, apart from indicating that the two outermost loops can run in parallel on the target accelerator, in our case, the NVIDIA RTX 4090.
For more details about the parallel programming model, you can follow the following tutorials:
When we run the TornadoVM version with JMH, we obtain the following report:
Benchmark                                                  Mode  Cnt           Score          Error  Units
MatrixMultiplication.Benchmarking.mxmParallelVectorized    avgt    5    13586191.583 ±    78030.170  ns/op
MatrixMultiplication.Benchmarking.mxmSequential            avgt    5  2113164943.347 ± 17774213.889  ns/op
MatrixMultiplication.Benchmarking.mxmTornadoVM             avgt    5      814137.714 ±      587.040  ns/op
This is just under 1 millisecond (0.81 milliseconds), which means a speedup of 2595x compared to the Java sequential execution, and 16.6x faster than the vectorized Java multi-core version!
Comparing TornadoVM with Native OpenCL C++
Ok, that’s great, but how far is TornadoVM compared to OpenCL C++? Since we executed TornadoVM on the RTX 4090 using its OpenCL backend, we could implement an OpenCL program in C++ to solve the matrix multiplication.
If you are curious, we can download and run the OpenCL C++ versions from the following GitHub repository:
https://github.com/jjfumero/opencl-samples/tree/master/mxm
If we run the OpenCL C++ version on the same machine and the same GPU (and RTX 4090), we get the following result:
## -p <number> to select the OpenCL platform. In my case, platform 2 corresponds with the 4090 GPU
$ ./mxm -p 2
...
[INFO] OpenCL MxM
[INFO] Size = 1024x1024
[INFO] 3 has been detected
[INFO] Platform: 0
        [INFO] Vendor: Codeplay Software Ltd.
[INFO] Platform: 1
        [INFO] Vendor: Intel(R) Corporation
[INFO] Platform: 2
        [INFO] Vendor: NVIDIA Corporation
[INFO] Using platform: 2 --> NVIDIA Corporation
[INFO] Using Device with Index: 0 -> name: NVIDIA GeForce RTX 4090
[INFO] Kernel <mxm> loaded
…

Median KernelTime: 4.39085e+06 (ns)
Median CopyInTime: 631200 (ns)
Median CopyOutTime: 268384 (ns)
Median TotalTime: 4.73631e+06 (ns)      << End-To-End time
Note that the application launches the kernel 100 times, and it computes the median timers for the kernel runtime, copy-in/copy out, and total time. In addition, to make it fair with TornadoVM, it copies the input data only once (just as TornadoVM does when declaring the transfer to device data as FIRST_EXECUTION).
We are interested in the total time, which represents the end-to-end time, including data transfer and kernel execution of the whole application, in order to make it comparable with the TornadoVM reported timers.
We see that the total time in OpenCL is 4.7 milliseconds. This means that the OpenCL C++ version is 5.8x slower than TornadoVM! Is this possible? How?
The answer is that TornadoVM applies a lot of optimizations for us in order to increase performance. TornadoVM is more than a pure translator from Java to OpenCL. It also optimizes the code. In fact, TornadoVM optimizes the code in two ways:
- Compiler optimizations: e.g., parallel-thread-id insertion, math optimizations, etc.
- Runtime optimizations: e.g., better thread-scheduling.
But, is this a fair comparison? My initial thoughts are, no. It is not fair because the OpenCL native version implements a naive matrix multiplication without any optimization, as we can see from the following code snippet.
__kernel void mxm(__global float *a,  __global float *b, __global float *c, const int n) {

	uint idx = get_global_id(0);
	uint jdx = get_global_id(1);

	float sum = 0.0;
	for (int k = 0; k < n; k++) {
		sum += a[idx * n + k] * b[k * n + jdx];
	}
	c[idx * n + jdx]  =  sum;
}
However, despite implementing a basic sequential approach with two annotations, the TornadoVM version was also not optimized, and the JIT compiler is able to apply well known optimizations (as we will discuss in a bit) to improve performance. But to achieve high performance in OpenCL, CUDA, and SYCL, software optimization is crucial. Without optimization, significant performance gains could have been left untapped.
Understanding TornadoVM Performance
So, where is the “magic”? TornadoVM actually performs well-known compiler optimizations for GPUs, and it could even be faster than it actually is.
For this second part of the post, let’s do the following. Let’s try to explore, step by step, all optimizations that TornadoVM applies in order to achieve such a high performance. Our goal now is to improve our native OpenCL C++ code in order to match the performance of TornadoVM.
Before we dive into all the optimizations, let’s do a recap. The following performance plot shows a summary of the different implementations we have executed so far.
The plot shows the total runtime in nanoseconds of each implementation. Thus, the lower the better. The red line shows the total runtime of the Java sequential implementation. The dash lines show, just for reference, the 1 second and 1 millisecond marks.

How can we know the optimizations applied in TornadoVM?
For this post, we are going to analyse the optimizations applied by studying the generated OpenCL code that the TornadoVM JIT compiler generates. To dump the OpenCL generated kernels, you need to pass the --printKernel option from the command line to TornadoVM.
However, if you want to dive deep into the whole list of optimizations, you can use the IGV (Ideal Graph Visualizer. IGV is a tool developed by the GraalVM team to visualize the Intermediate Representation (IR) for all compiler optimizations within Graal. But, since TornadoVM extends the Graal compiler, it can also use the IGV tool as an IR debugger.
To enable IGV with TornadoVM, you need to install IGV from the GraalVM repository:
https://github.com/oracle/graal/blob/master/docs/tools/ideal-graph-visualizer.md
And then use the --igv option with TornadoVM:
tornado --igv MyProgram
As I mentioned before, we are not going to use IGV for this post, but for the future, I am planning to write about IGV with TornadoVM in detail, allowing TornadoVM and GraalVM users to get a sense of the optimizations being applied, and even apply your own optimizations.
1_Loop_Interchange
The following code snippet shows a sketch of the generated OpenCL kernel by the TornadoVM JIT compiler. Let’s focus on the general control flow structure. We see three nested loops that correspond to the three loops from the original Java code.
The first thing to notice is that the loops seem to be interchanged. The induction variable for the outermost loop uses the function get_global_id(1) from OpenCL, and the first nested loop uses the get_global_id(0).
Note that In TornadoVM, a parallel loop is replaced by a get_global_id(parallelDimension). Although it keeps the loop structure, it iterates in steps of get_global_size(parallelDimension).
__kernel void mxmTornadoVM(__global long *_kernel_context,
                           __constant uchar *_constant_region,
                           __ocal uchar *_local_region,
                           __global int *_atomics,
                           __global uchar *a,
                           __global uchar *b,
                           __global uchar *c,
                           __private int size) {
  // BLOCK 0
  ul_0  =  (ulong) a;
  ul_1  =  (ulong) b;
  ul_2  =  (ulong) c;
  i_3  =  get_global_size(0);
  i_4  =  get_global_size(1);
  ul_5  =  ul_2 + 32L;
  ul_6  =  ul_1 + 32L;
  ul_7  =  ul_0 + 32L;
  i_8  =  get_global_id(0);
  i_9  =  get_global_id(1);
  // BLOCK 1 MERGES [0 8 ]
  i_10  =  i_9;
  for(;i_10 < 1024;)                        // get_global_id(1)
  {
    // BLOCK 2
    i_11  =  i_10 << 10;
    i_12  =  i_11 + 6;
    // BLOCK 3 MERGES [2 7 ]
    i_13  =  i_8;
    for(;i_13 < 1024;)                      // get_global_id(0)
    {
      // BLOCK 4
      i_14  =  i_13 + 6;
      // BLOCK 5 MERGES [4 6 ]
      f_15  =  0.0F;
      i_16  =  0;
      for(;i_16 < 1024;)
      {
               // innermost loop

       }  // B6
    }  // B7
  }  // B8
}  //  kernel
We see that TornadoVM applies a very well-known compiler optimization called loop interchange, in which two loops can be reordered and swapped to increase performance by reducing memory cache misses.
In a nutshell, if we have the following structure, an optimizing compiler could reorder any of the loops if the loops are perfectly nested.
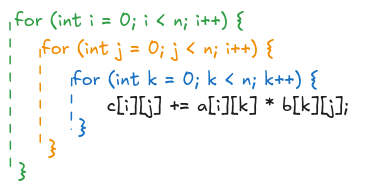
There are many combinations that an optimizing compiler could apply. For example, interchange i <-> j, or j <-> k, etc. We are going to manually apply the one selected by the TornadoVM JIT compiler, which is interchanging the i and j loops as follows:

To run this version from our OpenCL C++ program:
$ ./mxm -p 2 -k mxmLI
…
Median KernelTime: 730448 (ns)
Median CopyInTime: 699264 (ns)
Median CopyOutTime: 271024 (ns)
Median TotalTime: 1.08369e+06 (ns)
We have improved our OpenCL program runtime from 4.7 ms to 1.08 ms (4.3x) just by enabling loop interchange.
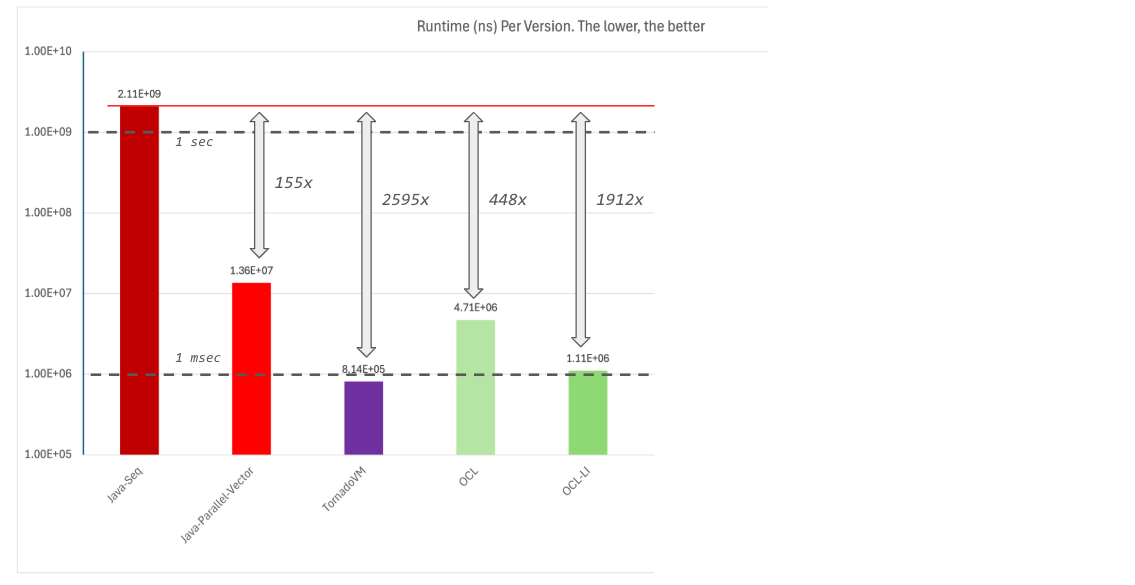
This optimization allows us to increase the speedup from 448x to 1912x compared to Java, but still, far away from TornadoVM. What else is TornadoVM optimising?
2_FMA_Instruction
When we look closely at the TornadoVM generated code for the Matrix Multiplication, we see that TornadoVM is also able to generate FMA instructions. FMA (Fused multiply-add) is a common optimization to execute a multiplication followed by an addition in a single instruction.
  ...
  ul_30  =  ul_25 + l_29;
  f_31  =  *((__global float *) ul_30);
  f_32  =  fma(f_23, f_31, f_15);  // FMA operation generated by the TornadoVM JIT Compiler
  i_33  =  i_16 + 1;
  f_15  =  f_32;
  ...
Let’s apply this optimization in our OpenCL kernel:
__kernel void mxmLIfma(__global float *a,  __global float *b, __global float *c, int n) {
	uint idx = get_global_id(1);
	uint jdx = get_global_id(0);
	float sum = 0.0f;
	for (int k = 0; k < n; k++) {
	    float op1 = a[idx * n + k];
	    float op2 = b[k * n + jdx];
	    sum = fma(op1, op2, sum);
	}
	c[idx * n + jdx]  =  sum;
}
When we run this application:
./mxm -p 2 -k mxmLIfma
...
Median KernelTime: 730976 (ns)
Median CopyInTime: 669280 (ns)
Median CopyOutTime: 267440 (ns)
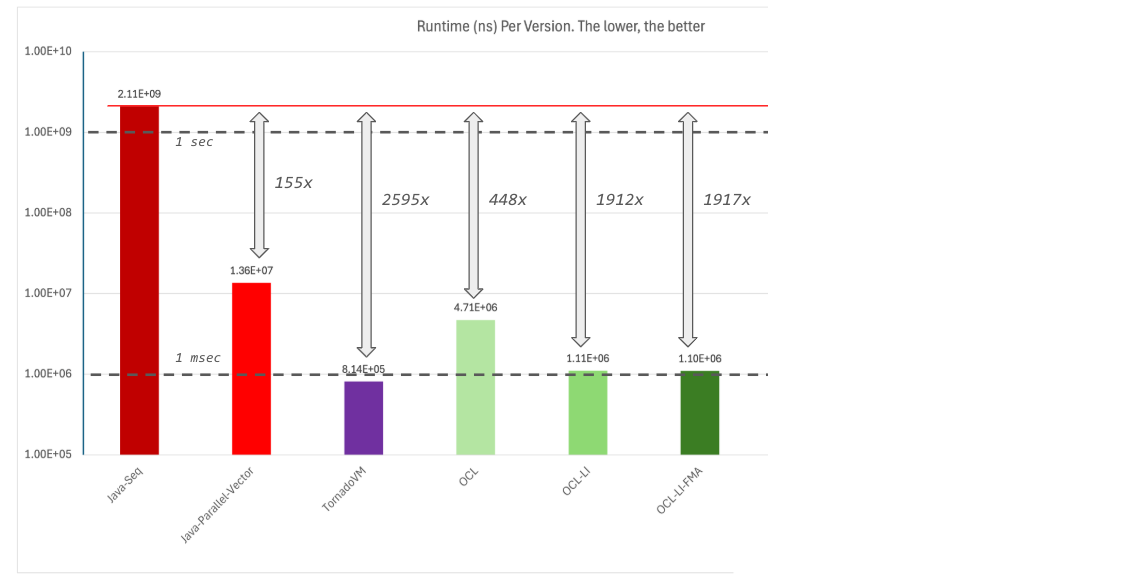
Median TotalTime: 1.07918e+06 (ns)
This looks a bit faster. Let’s plot this new number and compare it with the rest of the implementations.
3_Loop_Unroll
Let’s continue our exploration of optimizations. When looking again at the general control flow structure of the generated kernel, we see that TornadoVM was able to replace the loop bounds (size parameter from Java) with the actual matrix size:
  // first loop
  for(;i_10 < 1024;)     // get_global_id(1)
  {
    // second loop
    for(;i_13 < 1024;)   // get_global_id(0)
    {
        for (... ) { ... }
    }
  }
This can create a new opportunity for optimizations for the underlying OpenCL JIT compiler. This is because the final compilation step is performed by the OpenCL driver, which in our case, is the NVIDIA driver. This compiler could potentially apply loop unrolling and group instructions to use vector types.
__kernel void mxmLIfmaUnroll(__global float *a,  __global float *b, __global float *c, int n) {

	uint idx = get_global_id(1);
	uint jdx = get_global_id(0);

	float sum = 0.0;

	#pragma unroll 32
	for (int k = 0; k < n; k++) {
	    float op1 = a[idx * n + k];
	    float op2 = b[k * n + jdx];
	    sum = fma(op1, op2, sum);
	}

	c[idx * n + jdx]  =  sum;
}
We can tune the loop unroller using different values. In my case I selected 32 iterations with the intention to match the wrap size on NVIDIA GPUs. However, as we will see, this optimization will not do too much in this context. Although the TornadoVM JIT can also apply loop unrolling by itself, I initially thought this could be beneficial for this kernel. So, what is the performance of this implementation?
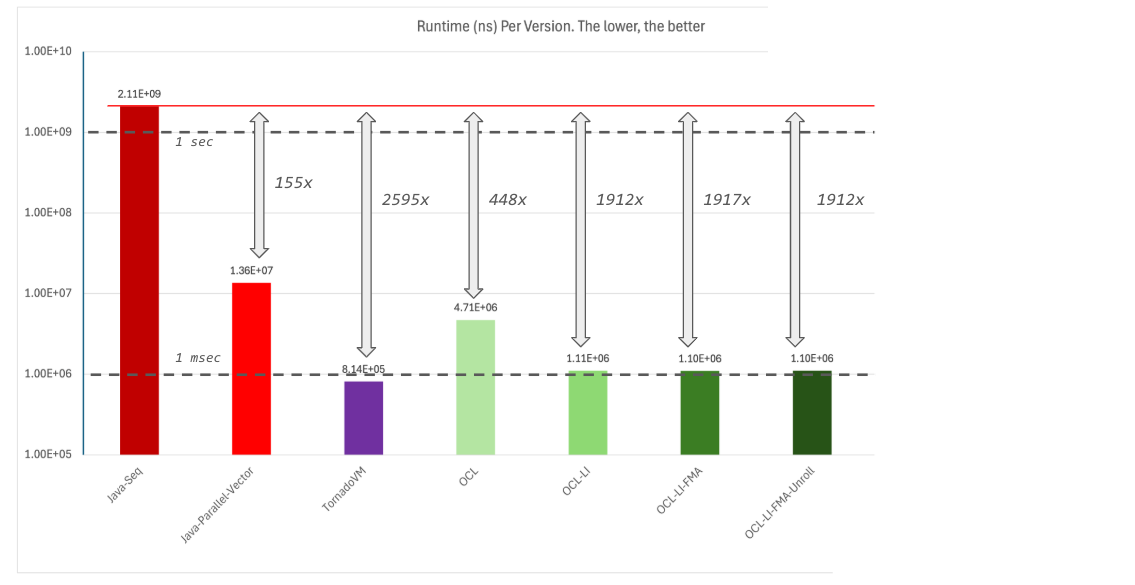
As you can see from the previous performance plot, it looks like this version performs worse than the previous optimization. Let’s keep that in mind and continue with the rest of the enhancements in TornadoVM.
4_Compiler_Flags
Another optimization that TornadoVM applies is that it passes, by default, certain compiler flags to the NVIDIA OpenCL JIT compiler for the clBuildProgram function invocation.
-cl-mad-enable -cl-fast-relaxed-math
The first flag replaces the fma with a mad operation, which computes fma with reduced accuracy. The second flag tells the NVIDIA JIT compiler to make assumptions about valid data (e.g., no NaNs, +Inf, etc). This enables faster computation at the cost of precision.
When we run this version, we see again some performance regression. Not by much, but I have the feeling that the loop unroll was not a good decision. So let’s remove it for the next versions.
5_Runtime_Thread_Block
When programming for GPUs, compiler optimizations are as important as scheduling optimizations. One of the things I noticed is that TornadoVM selects a specific block of threads. But, what does it mean exactly?
In OpenCL (and CUDA and SYCL too), developers can select a specific block of threads that can run concurrently on a Streaming Multiprocessor (SM) of the GPU. All threads within the same block will run on a SM (equivalent to a CPU core). These threads can share memory and can synchronize. Besides, GPUs have the excellent capability of potentially running multiple blocks in the same SM concurrently, increasing resource utilization.
What we want to achieve is to maximise resource utilisation and improve occupancy of the GPU. Choosing the right block is crucial to help improve occupancy: if the block of threads is too large, then the GPU scheduler can’t schedule multiple blocks to the same SM. In contrast, if it is too small, we might underutilize GPU resources. Finding the right balance is key.
Unfortunately, there is no single solution, and this is more try-and-error and playing with heuristics. While there are some guidelines, TornadoVM implements an heuristic following the NVIDIA guidelines for improving occupancy.
You can enable the --printThreads option in TornadoVM to dump the thread-block along with other scheduling information to debug the scheduler in real time.
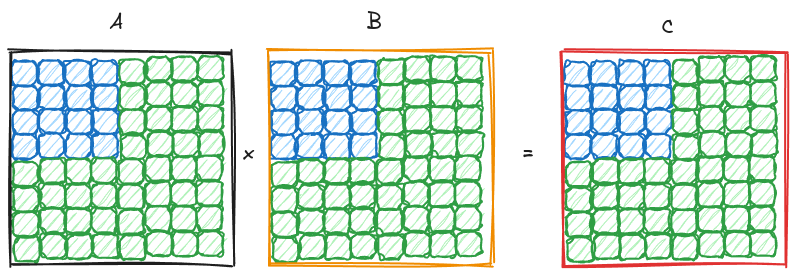
For this particular problem and the RTX 4090 GPU, TornadoVM selected blocks of threads of 16x16 (in 2D). If we enable the same thread-block scheduling in our OpenCL program, we obtain the following performance:
$ ./mxm -p 2  -f -k mxmLIfma -w 16

…
Median KernelTime: 463616 (ns)
Median CopyInTime: 742368 (ns)
Median CopyOutTime: 265824 (ns)
Median TotalTime: 808460 (ns)
The total time now is below one millisecond. When we compare this new version against the previous ones, we see that the new OpenCL program achieves 2594x compared to Java, and practically the same speedup as TornadoVM!
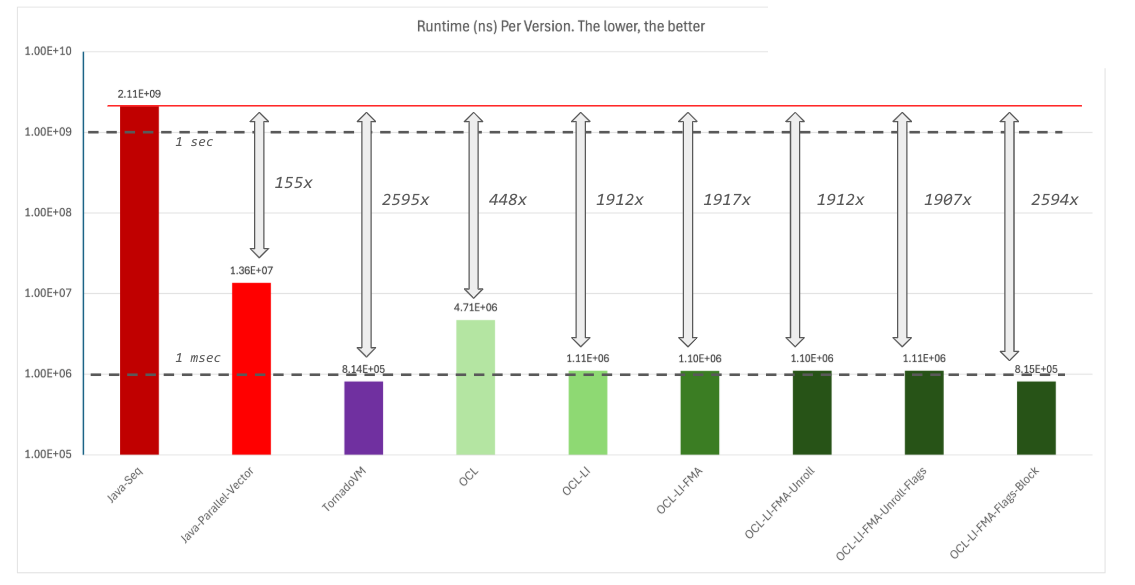
We made it! These are all the main optimizations exploited by TornadoVM to achieve performance. The following performance graph shows the impact of each optimization compared to TornadoVM (the higher, the better).
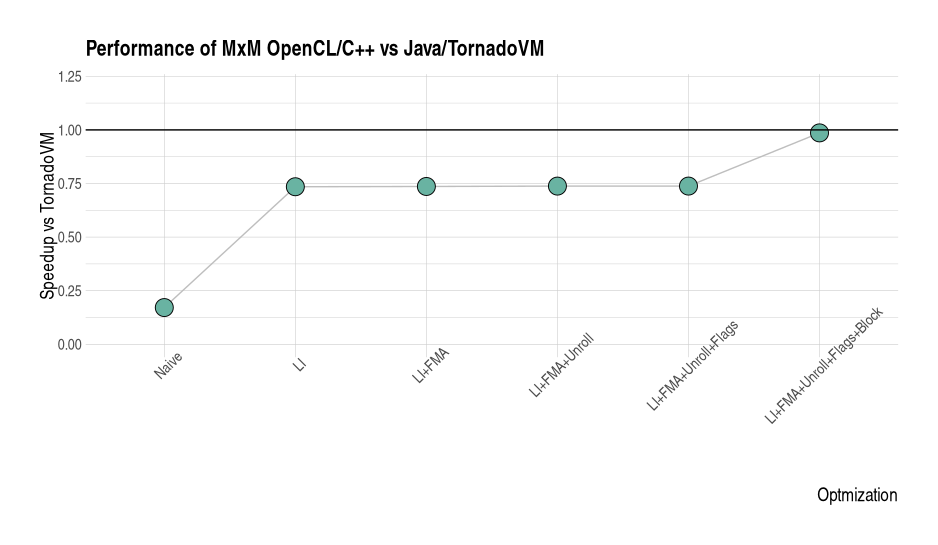
But to be fair, as soon as loop-interchange and the right thread-block are enabled, we can obtain the same speedup as the TornadoVM version.
Discussion about GPU Optimizations
As you can see, TornadoVM is able to minimally optimize the program, achieving great results. But if you know Matrix Multiplication and GPUs, you will know that more optimizations can be implemented. Two more important optimizations play an important role in this application:
- Exploitation of shared (as in CUDA) or local (as in OpenCL) memory.
- Using loop-tiling within the kernel.
While the TornadoVM upstream version does not offer these optimizations, there are a few experiments showing the potential of this in the TornadoVM JIT compiler. achieving an extra 2.5x just by using local memory.
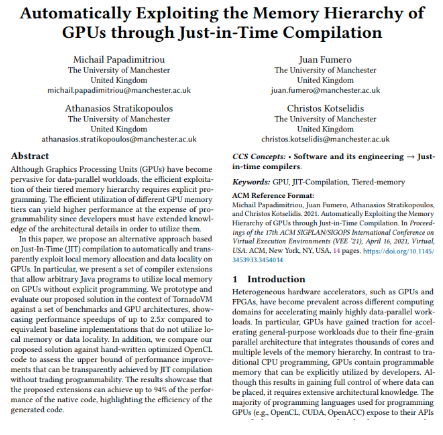
Link to the paper: link
Hopefully, future TornadoVM versions will integrate this PoC into the main open-source public branch.
Is TornadoVM always better than Native OpenCL?
No, it is not. The example used in this post is not representative of every application you can run with TornadoVM. In some cases, you might get better performance compared to a non-optimize GPU code. However, this is very rare.
What TornadoVM aims to achieve is a balance between programming effort and performance portability. Hopefully, future TornadoVM versions will include smarter and better optimizations. Besides, since TornadoVM is open-source, anyone can contribute to improve TornadoVM.
FLOPS Achieved for each version
We can measure the Floating Points Operations Per Second (FLOP/s) for each of the versions, and compare it against the maximum theoretical FLOP/s of the system. Since we are running the application on two different processing units, we need to compare each version to its own theoretical target. This is the maximum theoretical performance for the CPU for the Java versions, and the maximum theoretical performance for TornadoVM and OpenCL when using the GPU.
For the NVIDIA GPU, the manufacturer publishes this number along with the all the GPU specifications:
https://www.techpowerup.com/gpu-specs/geforce-rtx-4090.c3889 .
We can see that for the 4090 GPU, the theoretical maximum performance in FP32 is 82.58 TFlops (82580 GFLOPS).
For the Intel CPUs I could find this public document from Intel specifying the GFLOPS for the most recent Intel processors. The Intel i9 13900K sets 1152 GFLOPS (although my initial theoretical calculations were a bit higher, taking into account that we can execute up to 16 FMA instructions per cycle, but let’s go with what it seems to be the official number).
Let’s now compute the GLOPS achieved and the % of the theoretical maximum:
| Version | GLOP/s | Max. Theoretical Perf. | % Max |
|---|---|---|---|
| Java Sequential | 1.04 | 1152 (CPU) | 0.09% |
| Java Parallel Vectorized | 152 | 1152 (CPU) | 13.19% |
| TornadoVM | 2207 | 82580 (RTX 4090 GPU) | 2.67% |
In reality, it is very hard to pass, or even achieve 60% of the maximum theoretical performance, and it depends on many factors such as bandwidth limitations, thermals. etc.
But, by looking at these results, it seems that TornadoVM performs very poorly. Let’s compare TornadoVM with the Matrix Multiplication implemented in the CUDA Sample suite using the same matrix size on the RTX 4090 GPU:
$ ./matrixMul -wA=1024 -hA=1024 -wB=1024 -hB=1024


[Matrix Multiply Using CUDA] - Starting...
GPU Device 0: "Ada" with compute capability 8.9

MatrixA(1024,1024), MatrixB(1024,1024)
Computing result using CUDA Kernel...
done
Performance= 6510.26 GFlop/s, Time= 0.330 msec, Size= 2147483648 Ops, WorkgroupSize= 1024 threads/block
Checking computed result for correctness: Result = PASS
CUDA is able to achieve 6.5 TFlops, this is 3x faster than TornadoVM, and it achieves ~7% of the maximum theoretical peak performance. However, in a closer look to the CUDA sample source code, we see that the time reported is the kernel time, not the end-to-end time.
  // Record the start event
  checkCudaErrors(cudaEventRecord(start, stream));

MatrixMulCUDA<16><<<grid, threads, 0, stream>>>(d_C, d_A, d_B, dimsA.x, dimsB.x);

// Record the stop event
checkCudaErrors(cudaEventRecord(stop, stream));

// Wait for the stop event to complete
checkCudaErrors(cudaEventSynchronize(stop));
float msecTotal = 0.0f;
checkCudaErrors(cudaEventElapsedTime(&msecTotal, start, stop));
To compare it, we can enable profiling information in TornadoVM to print the kernel execution time too using the flag --enableProfiler console:
{
    "mxm": {
        "COPY_IN_TIME": "0",
        "TOTAL_TASK_GRAPH_TIME": "1082216",
        "TOTAL_DISPATCH_DATA_TRANSFERS_TIME": "12992",
        "TOTAL_KERNEL_TIME": "438144",
        "COPY_OUT_TIME": "992",
        "TOTAL_DISPATCH_KERNEL_TIME": "3616",
        "ALLOCATION_BYTES": "12583104",
        "TOTAL_COPY_OUT_SIZE_BYTES": "4194368",
        "mxm.mxm": {
            "BACKEND": "OPENCL",
            "METHOD": "Multiplication.mxmTornadoVM",
            "DEVICE_ID": "0:0",
            "DEVICE": "NVIDIA GeForce RTX 4090",
            "TOTAL_COPY_IN_SIZE_BYTES": "24",
            "POWER_USAGE_mW": "24254",
            "TASK_KERNEL_TIME": "438144"             // GPU Elapsed Kernel Time by TornadoVM
        }
    }
}
TornadoVM achieves 4.9 TFlops just by looking at the kernel time (0.438 ms)! Not bad at all!
Conclusions
In conclusion, this exploration has shown the impressive performance capabilities of TornadoVM on GPUs, showcasing its ability to sometimes surpass even naive native OpenCL code in scenarios like matrix multiplication. Through automatic application of compiler and runtime optimizations, such as loop interchange and strategic thread block selection, TornadoVM bridges the gap between the ease of Java programming and the high performance achievable with hardware accelerators.
While the current version may not encompass all possible GPU optimizations, the framework’s potential for future enhancements, coupled with its open-source nature, holds promise for continued advancements in performance portability and streamlined parallel programming experiences.
To know more about TornadoVM: https://www.tornadovm.org/
References
Acknowledgments
I would like to thank my colleague Thanos Stratikopoulos from the University of Manchester for the constructive feedback.
Anexo
Performance with JMH on the 4090 Server:
Benchmark                                                  Mode  Cnt           Score          Error  Units
MatrixMultiplication.Benchmarking.mxmParallelStreams       avgt    5   105416705.030 ±  3718552.314  ns/op
MatrixMultiplication.Benchmarking.mxmParallelThreads       avgt    5   109084702.302 ±  5743253.306  ns/op
MatrixMultiplication.Benchmarking.mxmParallelVectorized    avgt    5    13586191.583 ±    78030.170  ns/op
MatrixMultiplication.Benchmarking.mxmSequential            avgt    5  2113164943.347 ± 17774213.889  ns/op
MatrixMultiplication.Benchmarking.mxmSequentialVectorized  avgt    5   191306987.055 ±   696420.220  ns/op
MatrixMultiplication.Benchmarking.mxmTornadoVM             avgt    5      814137.714 ±      587.040  ns/op