Measuring Kernel Time and Data Transfers with Level Zero
Published:
Key Takeaways & Outline
- Profiling and Timing Kernel Execution, as well as timing copies and data transfers between host and devices, are essential for every GPU and FPGA developer.
- This post shows how to time GPU kernel execution and buffer copies between host and devices on Intel GPUs with LevelZero.
- As an example, this post also shows how to measure and evaluate the performance of GPU kernels that perform matrix multiplication. Additionally, it provides an analysis of throughput for data copies between host <-> devices when using different buffer allocations in Level Zero.
- We found out that buffer copies between host <-> devices are generally faster when using
zeMallocHostcompared to heap memory for host buffers.
Introduction

Measuring and timing our code are essential tasks that every programmer and software engineer should have in their toolbox. Understanding potential bottlenecks and measuring the performance of different versions give the ability to programmers to improve their code and the overall performance of the applications. This is especially beneficial for developers programming heterogeneous hardware, such as GPUs and FPGAs.
In this post, we explain how to measure and time Level Zero applications. We will start by looking at how to time kernel execution on a GPU. Then, we will show how to time data transfers from host to device and vice-versa. All examples shown in this post are available on GitHub link; so, feel free to download and follow the explanations in this post.
Finally, we put into practice what we will learn in this post by timing a GPU kernel on Intel HD graphics. We also measured data transfers using the different types of buffer (device, shared and hosts buffers) allocations that are available in Level Zero.
Note that the examples shown are based on the tests for the Intel compute runtime and Level Zero available on GitHub.
1. Measuring GPU Kernel Time with Level Zero
In a nutshell, what we need is to create a buffer for storing a timestamp (which consists of 32 bytes to store four timestamps of eight bytes each), and set the timer once an event that we pass in the kernel launch, gets signalled.
The data type for the kernel timestamp is ze_kernel_timestamp_result_t.
Link: https://spec.oneapi.io/level-zero/latest/core/api.html#ze-kernel-timestamp-result-t
This data type contains two timestamps for the start and the stop of each kernel that is being profiled, one for the global execution and another for the context execution. Note that the difference between stop and start for each timestamp category (either global or context), should give you the same result.
The result is given in cycles (GPU cycles). Later on, we will explain how to compute the duration in nanoseconds, instead of the number of cycles. As follows, we explain, step by step, how to create the timestamp and associate the timer with the GPU kernel launch.
1.1 Create a buffer for the timestamp
We first create the timestamp buffer by using the zeMemAllocHost call. It could be a host allocated or shared allocated buffer.
void *timestampBuffer = nullptr;
zeMemAllocHost(context, &hostDesc, sizeof(ze_kernel_timestamp_result_t), 1, ×tampBuffer);
// Initialize the timer
memset(timestampBuffer, 0, sizeof(ze_kernel_timestamp_result_t));
1.2 Create an event with the flag for kernel timestamp.
Then we need to create an event (we take an event from an event pool already created). When creating the event, we need to pass the following flag:
ZE_EVENT_POOL_FLAG_KERNEL_TIMESTAMP
The event for a kernel timestamp is created as follows:
ze_event_handle_t kernelTsEvent;
ze_event_desc_t eventDesc = {ZE_STRUCTURE_TYPE_EVENT_DESC};
eventDesc.index = 0;   //Event Index from the EventPool
eventDesc.signal = ZE_EVENT_SCOPE_FLAG_HOST;
eventDesc.wait = ZE_EVENT_SCOPE_FLAG_HOST;
zeEventCreate(eventPool, &eventDesc, &kernelTsEvent);
1.3. Launch the GPU Kernel using the kernel event as a signal event
When we launch the kernel, we pass the event created as a signalled event as follows:
zeCommandListAppendLaunchKernel(
         cmdList,
         kernel,
         &dispatch,
         kernelTsEvent,   // Event to be signalled.
         0,
         nullptr);
1.4. Append the Kernel TimeStamp Query to a Command-List
At this point, we must append a new command (see below) to the same command list used for launching the kernel. This command instructs the LevelZero driver to store the timestamp once the event gets signalled. Therefore, we need to pass the kernel timestamp buffer and the event to be signalled by the kernel launch.
zeCommandListAppendQueryKernelTimestamps(
     cmdList,
     1u,   // Number of events
     &kernelTsEvent,
     timestampBuffer, // pointer to memory where the timer will be written
     nullptr,  // offsets
     nullptr,  // signal events
     0u,   // num of events to wait
     nullptr); // list of events to wait
1.5. Close the command list and command queue
zeCommandListClose(cmdList);
zeCommandQueueExecuteCommandLists(cmdQueue, 1, &cmdList, nullptr);
zeCommandQueueSynchronize(cmdQueue, std::numeric_limits<uint64_t>::max());
1.6. Read the timestamp
ze_kernel_timestamp_result_t *kernelTsResults = reinterpret_cast<ze_kernel_timestamp_result_t *>(timestampBuffer);
To compute the total duration of the kernel in nanoseconds, we need to query the device properties and get the time resolution of the device:
ze_device_properties_t deviceProperties = {};
zeDeviceGetProperties(device, &deviceProperties);
We can query the time resolution in nanoseconds for the GPU, as it follows:
uint64_t timerResolution = deviceProperties.timerResolution;
uint64_t kernelDuration = kernelTsResults->context.kernelEnd - kernelTsResults->context.kernelStart;
Then, we need to check the version of our device, also by using the properties struct that we just queried:
auto version1_2 = deviceProperties.stype == ZE_STRUCTURE_TYPE_DEVICE_PROPERTIES_1_2;
if (version1_2) {
   gpuKernelTimeInNanoseconds =  kernelDuration * (1000000000.0 / static_cast<double>(timerResolution));
} else {
   // Before to v1.2
   gpuKernelTimeInNanoseconds = kernelDuration * timerResolution;
}
You can check the whole example on GitHub (link). If you run the example, you will see something similar to this:
./mxm
Matrix Size: 512 x 512
Device   : Intel(R) UHD Graphics [0x9bc4]
Type     : GPU
Vendor ID: 8086
#Queue Groups: 1
Kernel timestamp statistics (prior to V1.2):
	Global start : 1378135538 cycles
	Kernel start: 830 cycles
	Kernel end: 529788 cycles
	Global end: 1378664600 cycles
	timerResolution: 83 ns
	Kernel duration : 528958 cycles
	Kernel Time: 43903514 ns
1.7. Example: Kernel Performance for MxM
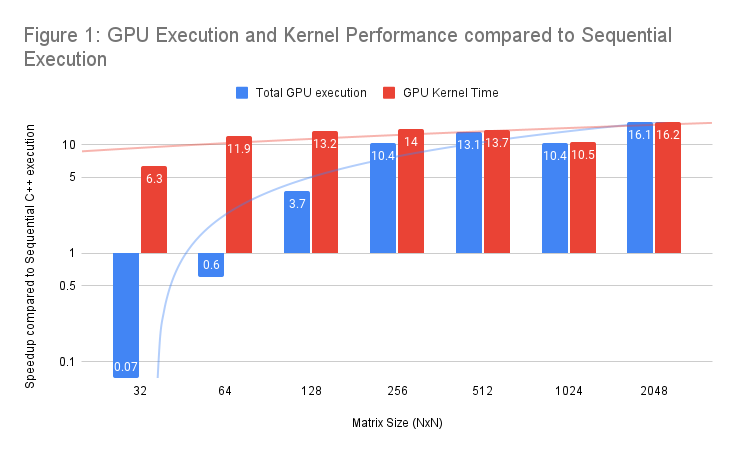
Now that we know how to measure kernel time, it is time to plot some performance numbers. We take the matrix multiplication application using floating-point numbers (single precision) and run it for 10 iterations for each size. We report the average value. The GPU we used is an Intel HD graphics 630 available on an Intel i7-8700K.
We execute the application for different input sizes, varying from 32x32 to a 2048x2048 matrix size of floating-point numbers. Figure 1 shows the performance of the GPU execution (total GPU execution), which includes all calls to dispatch the Level Zero application and synchronize with the host again (blue bars). The way we measured it, is as follows:
begin = std::chrono::steady_clock::now();
zeCommandListClose(cmdList);
zeCommandQueueExecuteCommandLists(cmdQueue, 1, &cmdList, nullptr);
zeCommandQueueSynchronize(cmdQueue, std::numeric_limits<uint64_t>::max());
end = std::chrono::steady_clock::now();
We also measured the GPU kernel time by using the described strategy (red bars). The bars (red and blue bars) represent speedup against the equivalent sequential execution on the CPU, therefore, the higher, the better.
We see that the kernel time for the matrix multiplication is between 6x and 16x faster compared to the CPU. However, we see a significant overhead when running for small data sizes. This is due to the runtime and kernel dispatch for all Level-Zero calls. As soon as we increase the data size, these overheads are negligible compared to the GPU kernel time. In essence, the computation overwhelms the time spend in runtime for dispatching and moving data; which is what we are looking for.

2. Measuring data transfers, or any time between different command lists
In this section, we will explain how to measure data transfers. The following process applies not only for measuring data transfers but also for timing the elapsed time between any sequential commands within a command list.
2.1 Allocate the timestamp buffers for start and stop.
First, we need to allocate buffers for the timestamps “start” and “stop” of any call we want to measure.
void *timeStampStartOut = nullptr;
void *timeStampStopOut = nullptr;
constexpr size_t allocSizeTimer = 8;
zeMemAllocDevice(context, &memAllocDesc, allocSizeTimer, 1, device, &timeStampStartOut);
zeMemAllocDevice(context, &memAllocDesc, allocSizeTimer, 1, device, &timeStampStopOut);
The buffer size is 8 bytes since we only need to store a long value with the timestamp.
2.2 Append the timestamp buffers
Then we append the buffers with timestamp buffers with the call zeCommandListAppendWriteGlobalTimestamp.
zeCommandListAppendWriteGlobalTimestamp(cmdList, (uint64_t *)timeStampStartOut, nullptr, 0, nullptr);
zeCommandListAppendMemoryCopy(cmdList, dstResult, sharedA, allocSize, nullptr, 0, nullptr);
zeCommandListAppendBarrier(cmdList, nullptr, 0, nullptr);
zeCommandListAppendWriteGlobalTimestamp(cmdList, (uint64_t *)timeStampStopOut, nullptr, 0, nullptr);
2.3 Copy back the timers from the device to host
Since we allocate the timestamps using a device buffer, we need to copy back those timestamps to the host by using the call zeCommandListAppendMemoryCopy:
uint64_t timeStartOut = 0;
uint64_t timeStopOut = 0;
zeCommandListAppendMemoryCopy(cmdList, &timeStartOut, timeStampStartOut, sizeof(timeStartOut), nullptr, 0, nullptr);
zeCommandListAppendMemoryCopy(cmdList, &timeStopOut, timeStampStopOut, sizeof(timeStopOut), nullptr, 0, nullptr);
2.4 Query the timer.
Similarly to the kernel timestamp, we need to obtain the device time resolution to compute the elapsed time of the data transfers in nanoseconds. We can do this as follows:
ze_device_properties_t devProperties = {ZE_STRUCTURE_TYPE_DEVICE_PROPERTIES};
zeDeviceGetProperties(device, &devProperties));

uint64_t copyOutDuration = timeStopOut - timeStartOut;
uint64_t timerResolution = devProperties.timerResolution;
std::cout << "Total Time: " << copyOutDuration * timerResolution << " ns\n";
2.5 Some Performance Numbers for Data Transfers
To put into practice what we have learnt, we measured different ways to copy in and out data from the device to host and vice versa using the described approach.
In Level-Zero, we can allocate memory using three different functions:
- Shared memory (
zeMallocShared) that shares a buffer between host and device. - Dedicated memory (
zeMallocDevice) allocates a buffer on the device. - Host memory (
zeMallocHost) memory that is allocated on the host side.
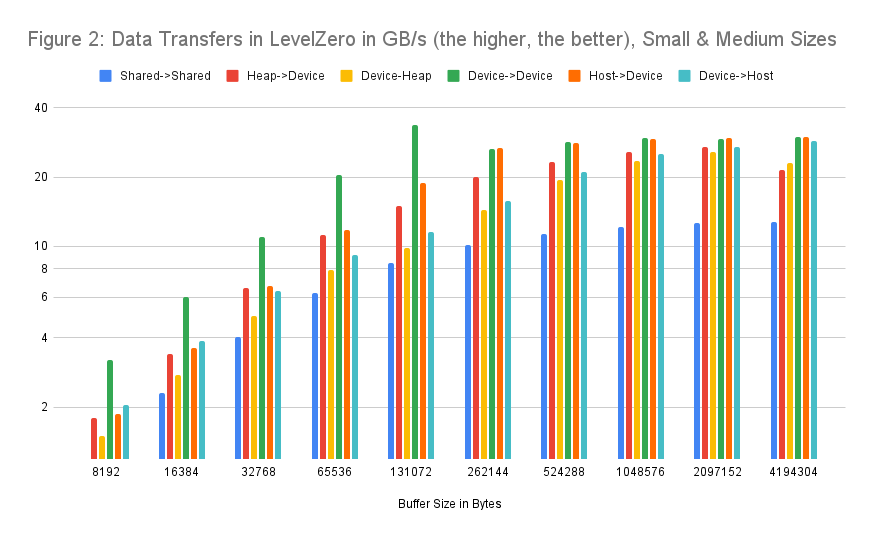
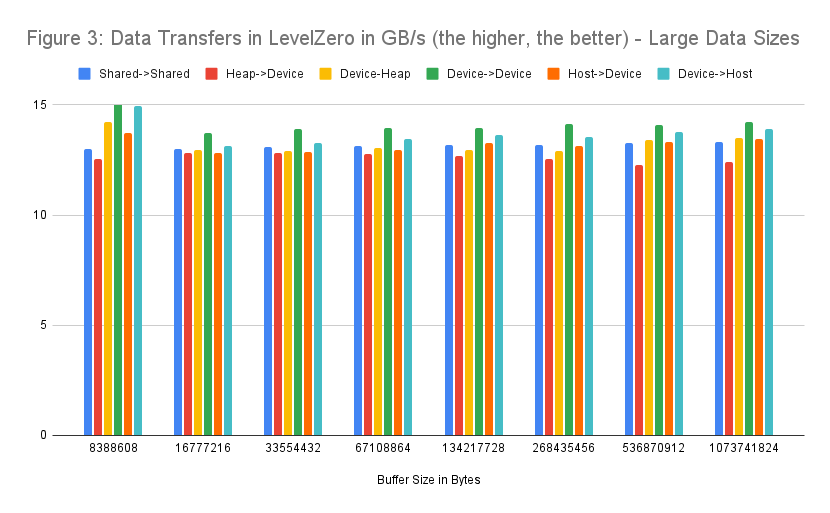
We measure the throughput, in GB/s for different input sizes, for each type of buffer in Level Zero. Figures 2 and 3 show the throughput of each size and buffer.
Hardware & Software details:
- Intel Compute-Runtime: 21.35.20826
- Level Zero: Using the latest commit
- CPU: i7-8700K
- GPU: Intel HD Graphics 630 Coffee Lake
How to read the performance graphs (Figures 2 and 3): X-axis shows the input size in bytes (from 8KB to 4MB) for the first graph and 8MB - 1GB for the second graph. Y-axis shows the throughput in GB/s (the higher the better). For each data size, there are six different versions shown as bars.
- Shared->Shared: Data transfer between two buffers allocated with shared memory.
- Heap->Device: Buffer allocated in C++ using the
newkeyword measuring the transfer from the host to the device. - Device->Heap: From the device to a buffer allocated with the
newkeyword in C++. - Device->Device: Data transfer between two buffers allocated with dedicated memory on the device.
- Host->Device: Host memory allocated with
zeMallocHostmeasuring the transfer from host to the device. - Device->Host: Host memory allocated with
zeMallocHostmeasuring the transfer from the device to the host.
As we see in Figure 2, the highest throughput is achieved when copying data from the device to the device buffers (internal copy within the device). The throughput performance achieved is up to 33 GB/s. We also see that, for small and medium data sizes, buffet using shared memory performs lower than the rest of the approaches with up to 11 GB/s.
Theoretically, copies of buffers allocated on the C/C++ heap (red and yellow bars) and zeHostMalloc from Level Zero (orange and light-blue bars) should perform the same. However, we see that usually host memory copies allocated with zeHostMalloc between host and device and vice versa are generally faster (up to 29 GB/s) for small and medium data sizes compared to 26 GB/s using C/C++ heap memory. A possible explanation would be that zeHostMalloc is using pinned memory by default. To confirm that speculation, further analysis of the driver is required.

Figure 3 shows the same throughput graph for large data sizes (8MB up to 1GB of memory). In this case, we see a general performance drop, from ~25 GB/s to 13 GB/s compared to small and medium data sizes (Figure 2). This is due to paging, with large page sizes (usually 4MB).

However, we notice the same trends as before. Device->Device copies are generally faster. Furthermore, copies of buffers allocated with zeMallocHost are generally faster than using heap memory (at least on the tested system).
3. Conclusions
Measuring the performance of compute kernels and the elapsed time between different commands (e.g., copy commands) are important tools to have in any programmer’s toolbox, especially for GPU and FPGA software developers and engineers.
This post has explained how to measure GPU kernel time with Intel LevelZero. Besides, it is shown how to measure the elapsed time for executing a command in a command list with the end goal to measure data transfers and copies between different buffers.
Finally, this post has provided an initial performance analysis by illustrating the performance of the matrix multiplication kernel and analyzed the performance of copies between different buffers in Level Zero. We have found that on the tested hardware platform, copies using the host malloc perform better than copies from the C/C++ heap to the device and vice-versa.
You can find the whole source code used as well as all scripts for measuring performance on GitHub:
Discussions
For discussions, feel free to add your comments and feedback on GitHub.
Acks
Thanks to Christos Kotselidis, Thanos Stratikopoulos from the University of Manchester for their constructive feedback, and Jaime Arteaga from Intel for the support and answering all my questions.