Profiling OpenCL and SPIRV code from TornadoVM using VTune
Published:
Key Takeaways
- Intel VTune is a powerful profiling tool for analysing CPU and GPU hotspots.
- TornadoVM can be used with Intel VTune to obtain fine-grained profiling information about the execution on Intel GPUs, such as the number of cycles per instruction and the assembly code that the driver generates from OpenCL and SPIRV kernels.
Intel VTune is a profiling tool for obtaining a detailed analysis of application hotspots, as well as GPU and CPU interaction. It also works with OpenCL, SPIRV, and Level Zero. In this post, we briefly explain how to start using Intel VTune to profile GPU and CPU kernels from TornadoVM.
Download VTune
VTune can be obtained as a standalone tool, or as part of the Intel oneAPI basic toolkit. On Linux OS systems, the default installation will place VTune under the directory:
/opt/intel/oneapi/vtune/latest/bin64/vtune
However, you can change the default directory when installing either VTune or Intel oneAPI.
The vtune application is a terminal command that is used to profile offline. Then, we can visualize the result of the profiling by invoking the GUI as follows:
/opt/intel/oneapi/vtune/latest/bin64/vtune-gui
Running a Command in TornadoVM
We are going to do the setup in TornadoVM to run a benchmark with the VTune profiling tool. For that, we are using the SGEMM application from TornadoVM’s benchmark suite.
We will run the benchmark via the OpenCL backend, but first, let’s take a look at how many devices are reachable from TornadoVM:
$ tornado --devices

Number of Tornado drivers: 1
Driver: OpenCL
  Total number of OpenCL devices  : 1

  Tornado device=0:1
	OPENCL --  [Intel(R) OpenCL HD Graphics] -- Intel(R) UHD Graphics [0x9bc4]
		Global Memory Size: 24.9 GB
		Local Memory Size: 64.0 KB
		Workgroup Dimensions: 3
		Total Number of Block Threads: 256
		Max WorkGroup Configuration: [256, 256, 256]
		Device OpenCL C version: OpenCL C 3.0
In our testbed, we have one device available, an Intel HD GPU Graphics. Let’s run now the benchmark without the VTune first.
# Note that TornadoVM has been configured with JDK 17
# (then we need to use modules)
$ tornado -m tornado.benchmarks/uk.ac.manchester.tornado.benchmarks.BenchmarkRunner
 sgemm 20 512 512
This command runs the selected benchmark (SGEMM) for 20 iterations and it uses a Matrix size of 512x512. This command will also run the Java sequential application to obtain a baseline.
The output is as follows:
bm=sgemm-20-512-512, id=java-reference      , average=2.495526e+08, median=2.491751e+08, firstIteration=2.469842e+08, best=2.469842e+08
bm=sgemm-20-512-512, device=0:1  , average=2.304047e+07, median=2.003370e+07, firstIteration=8.027470e+07, best=1.982096e+07, speedupAvg=10.8311, speedupMedian=12.4378, speedupFirstIteration=3.0767, CV=-0.0000%, deviceName= [Intel(R) OpenCL HD Graphics] -- Intel(R) UHD Graphics [0x9bc4]
Each line represents the execution on a different device. The first line shows the baseline (the Java sequential application), and the second line shows the performance when running the application on the Intel HD Graphics. It shows different metrics such as the time in nanoseconds that the first iteration took, the median and average speedup, etc.
Profiling with Intel VTune
To run VTune, at least on our testbed, we need to execute it as root. The following command shows how to obtain profiling information for the TornadoVM command above.
# Run as a root user
$ /opt/intel/oneapi/vtune/2022.1.0/bin64/vtune -c g-o
tornado
tornado.benchmarks/uk.ac.manchester.tornado.benchmarks.BenchmarkRunner sgemm 20 512 512
This command will generate a directory called r000go (if it is the first time we run the VTune Profiler) which contains a file called r000go.vtune. This file will be used by the Virtual Profiler (vtune-gui) to examine all profiling information.
Note that, in some systems, we will need to run the VTune command with the absolute paths to TornadoVM. This link provides an example using specific paths. To obtain the paths for your TornadoVM installation, you can execute tornado --flags.
Running VTune for Methods of Interest
The command above will profile the whole application and it will report all hotspots in our application. However, we can execute the VTune command for profiling only the methods of interest. The following command shows that:
# Run as a root user
$ /opt/intel/oneapi/vtune/2022.1.0/bin64/vtune -collect gpu-hotspots -knob profiling-mode=source-analysis -knob computing-tasks-of-interest=sgemm#1#1#4294967295 tornado
tornado.benchmarks/uk.ac.manchester.tornado.benchmarks.BenchmarkRunner sgemm 20 512 512
Again, in some systems, we might need to use full paths when using the TornadoVM command. See an example here https://gist.github.com/jjfumero/6f995e30c7dec6fb96443086763ef54b.
When running the profiler to collect hotspots on GPUs, VTune generates a directory in the style of rXXXgh. This directory will be used to visualize the profiling information through its GUI.
VTune-GUI
Now we are ready to inspect the results with the vtune-gui command. We will take the VTune file generated when collecting the GPU Hotspots for a specific method of interest (see the last command above). To open the GUI we execute the following command:
/opt/intel/oneapi/vtune/latest/bin64/vtune-gui

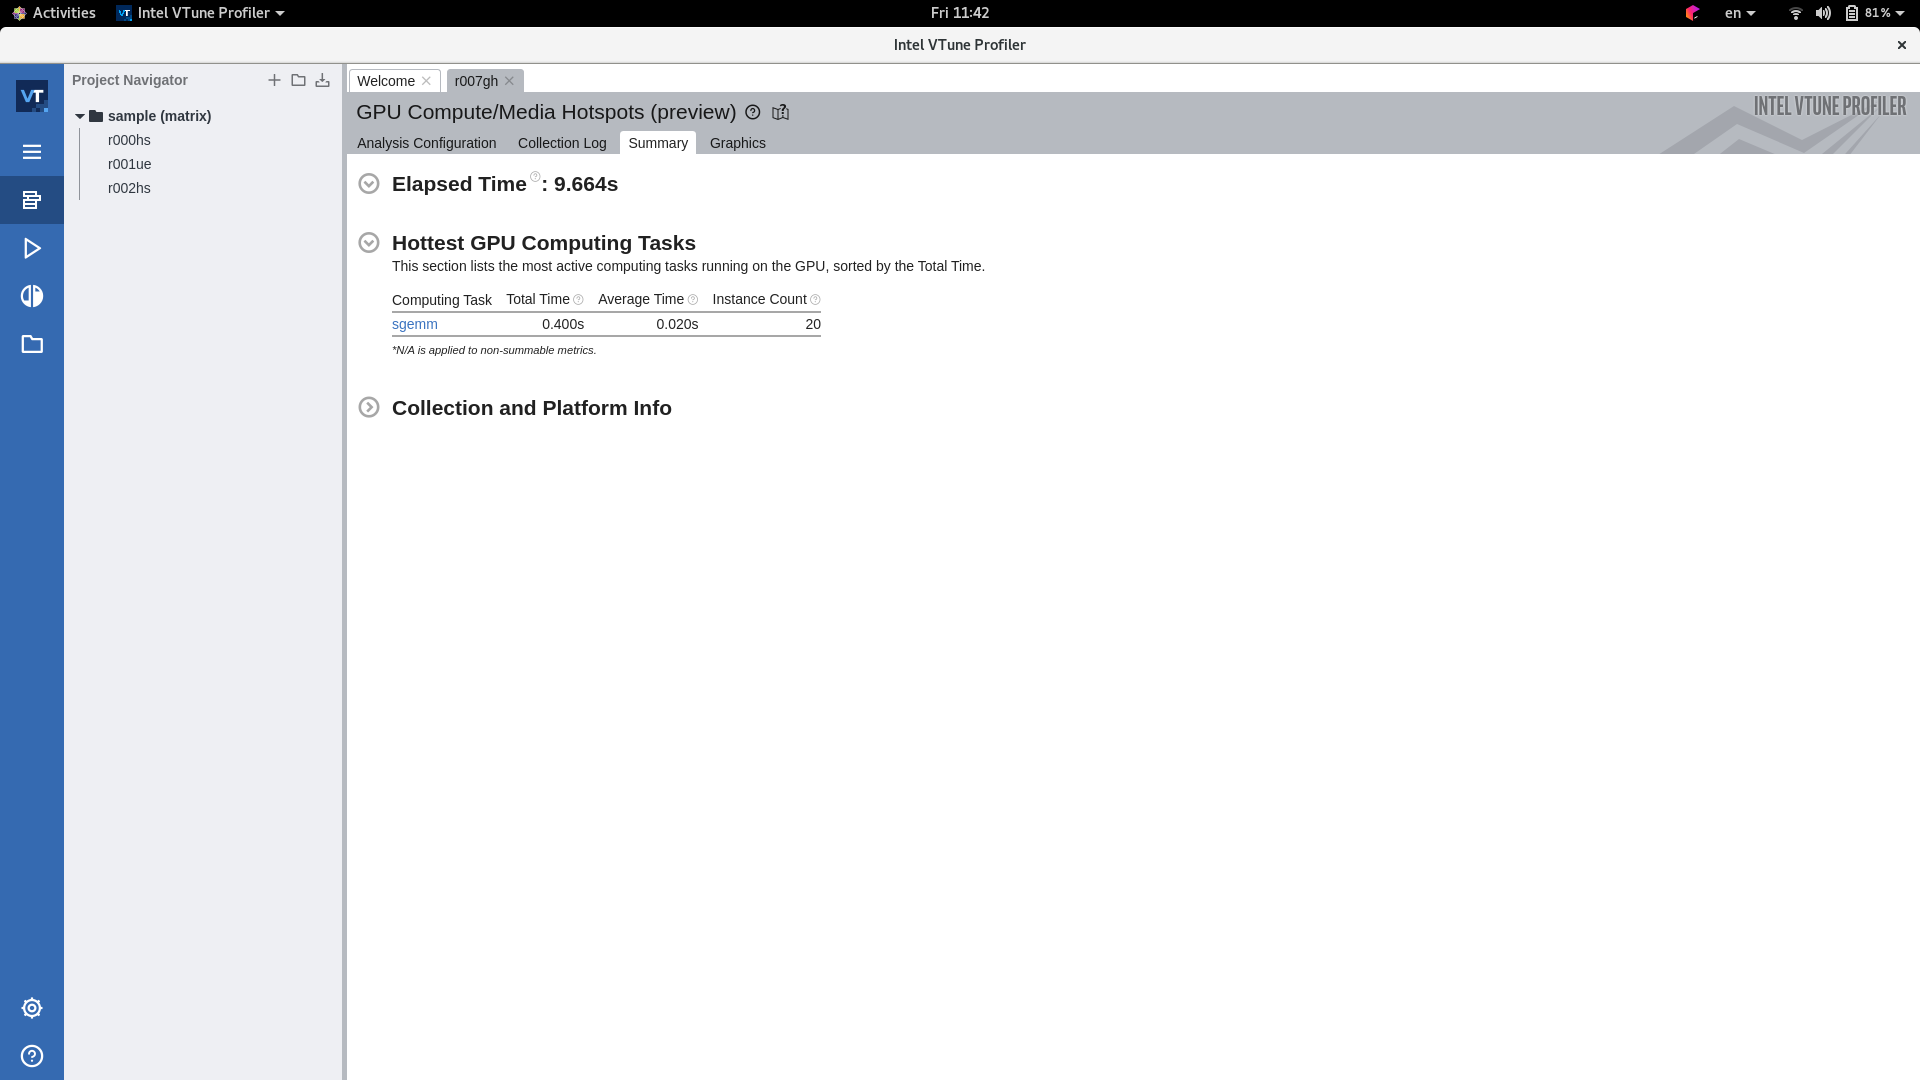
To load our profiling file, we select “Open Result” from the left-hand side panel. The file to open is under the folder r001gh and the file is r001gh/r001gh.vtune. Once we load the file, we will see a screen similar to this:

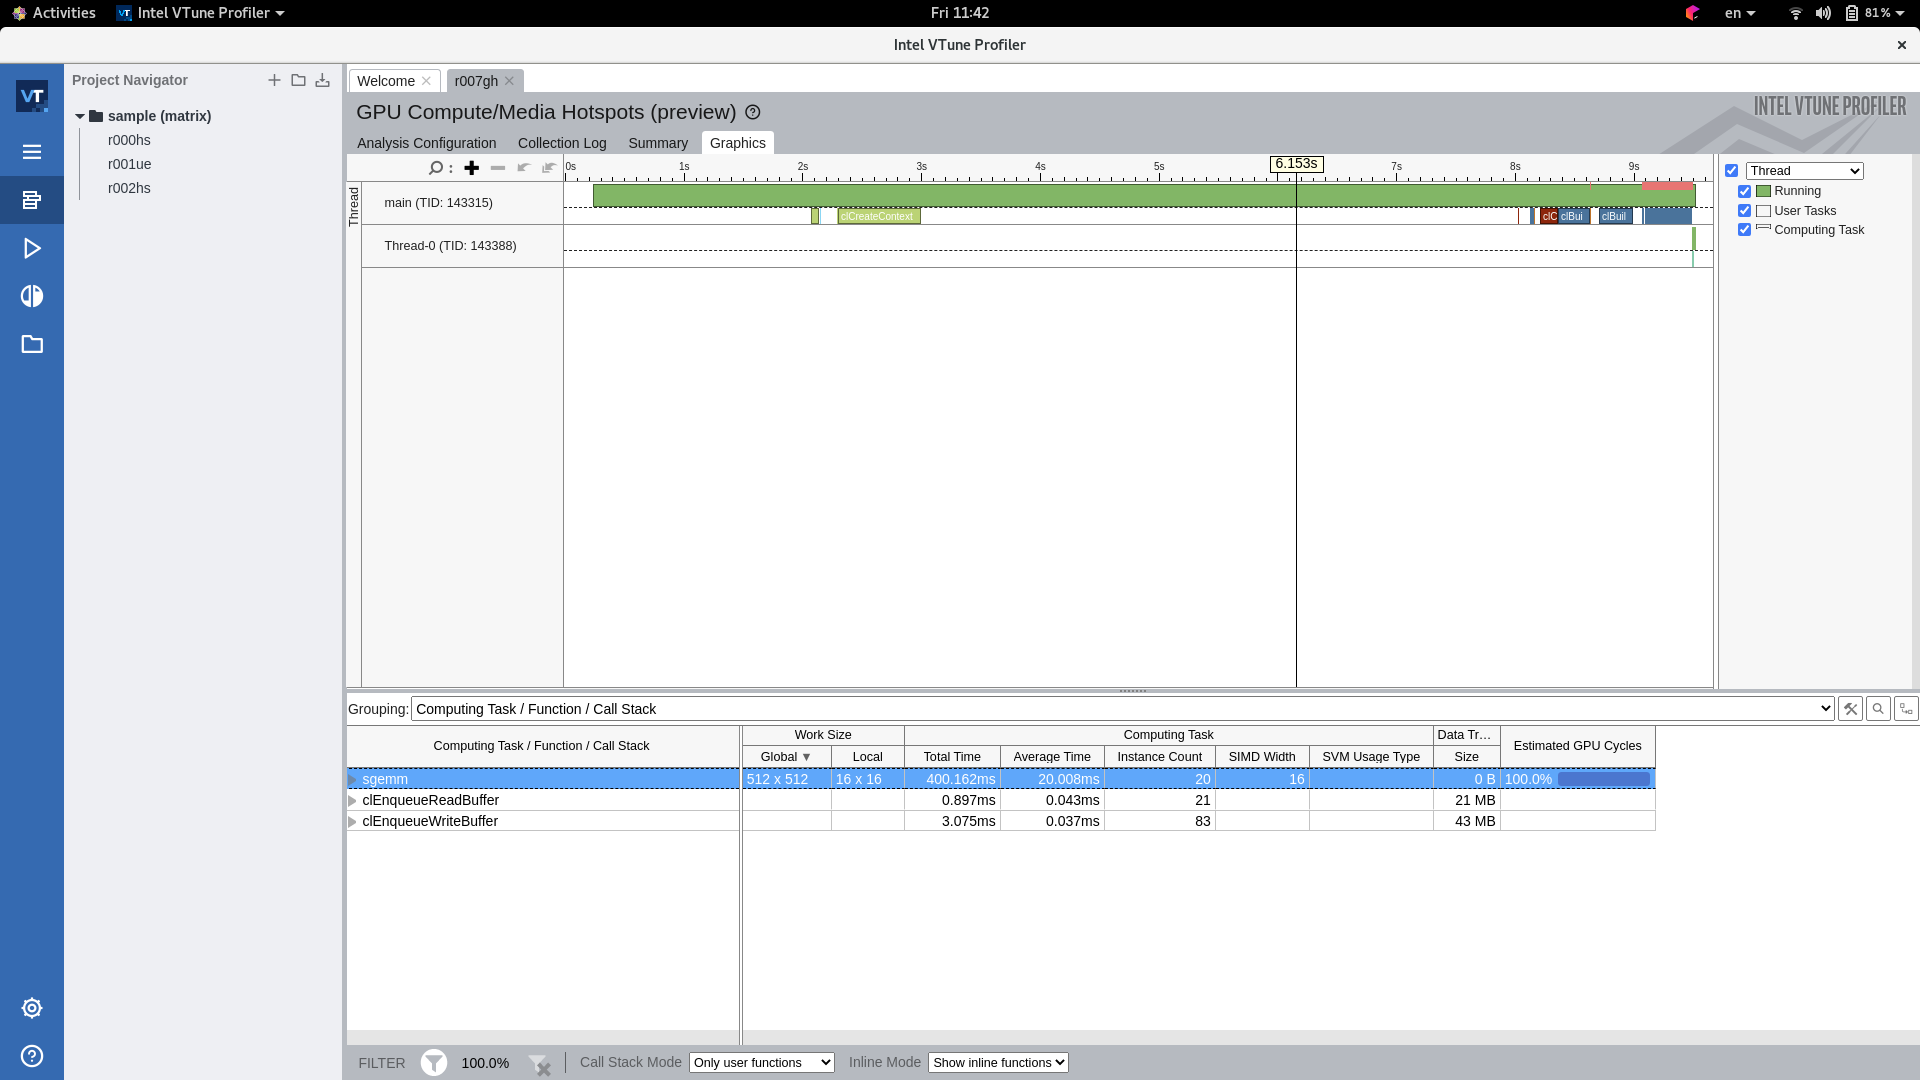
If we click on the SGEMM link, it will open the profiling data of the whole method.

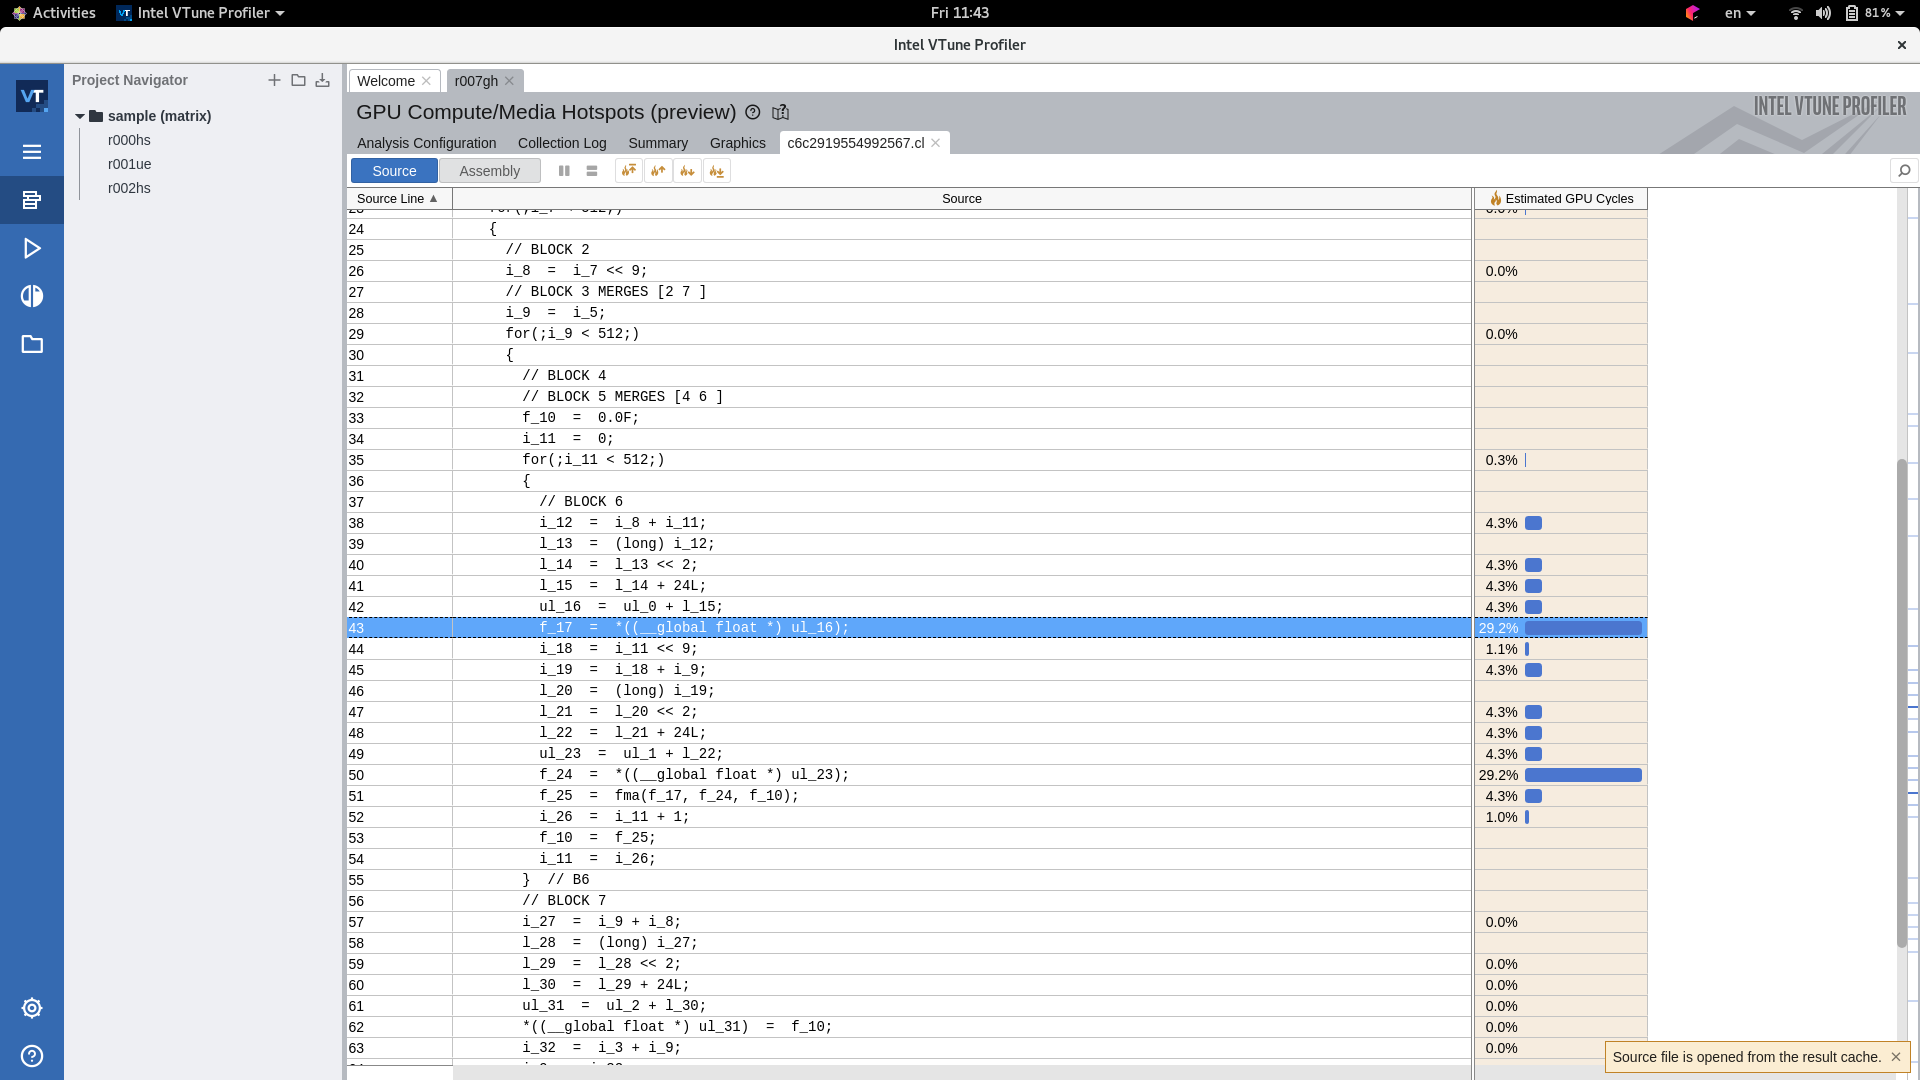
In the bottom pane, we can see that we have executed the sgemm method 20 times (that is the times we run our benchmark from Java) and the estimated GPU cycles are 100% of the total execution. This makes sense since the only method we profiled (the method of interest) is the one that invokes the GPU execution. If we click on the right-arrow that says sgemm, it will expand with a new tab. If we double click on the blue part “Estimated GPU Cycles”, it will open the OpenCL source file with an estimated number of cycles per statement.

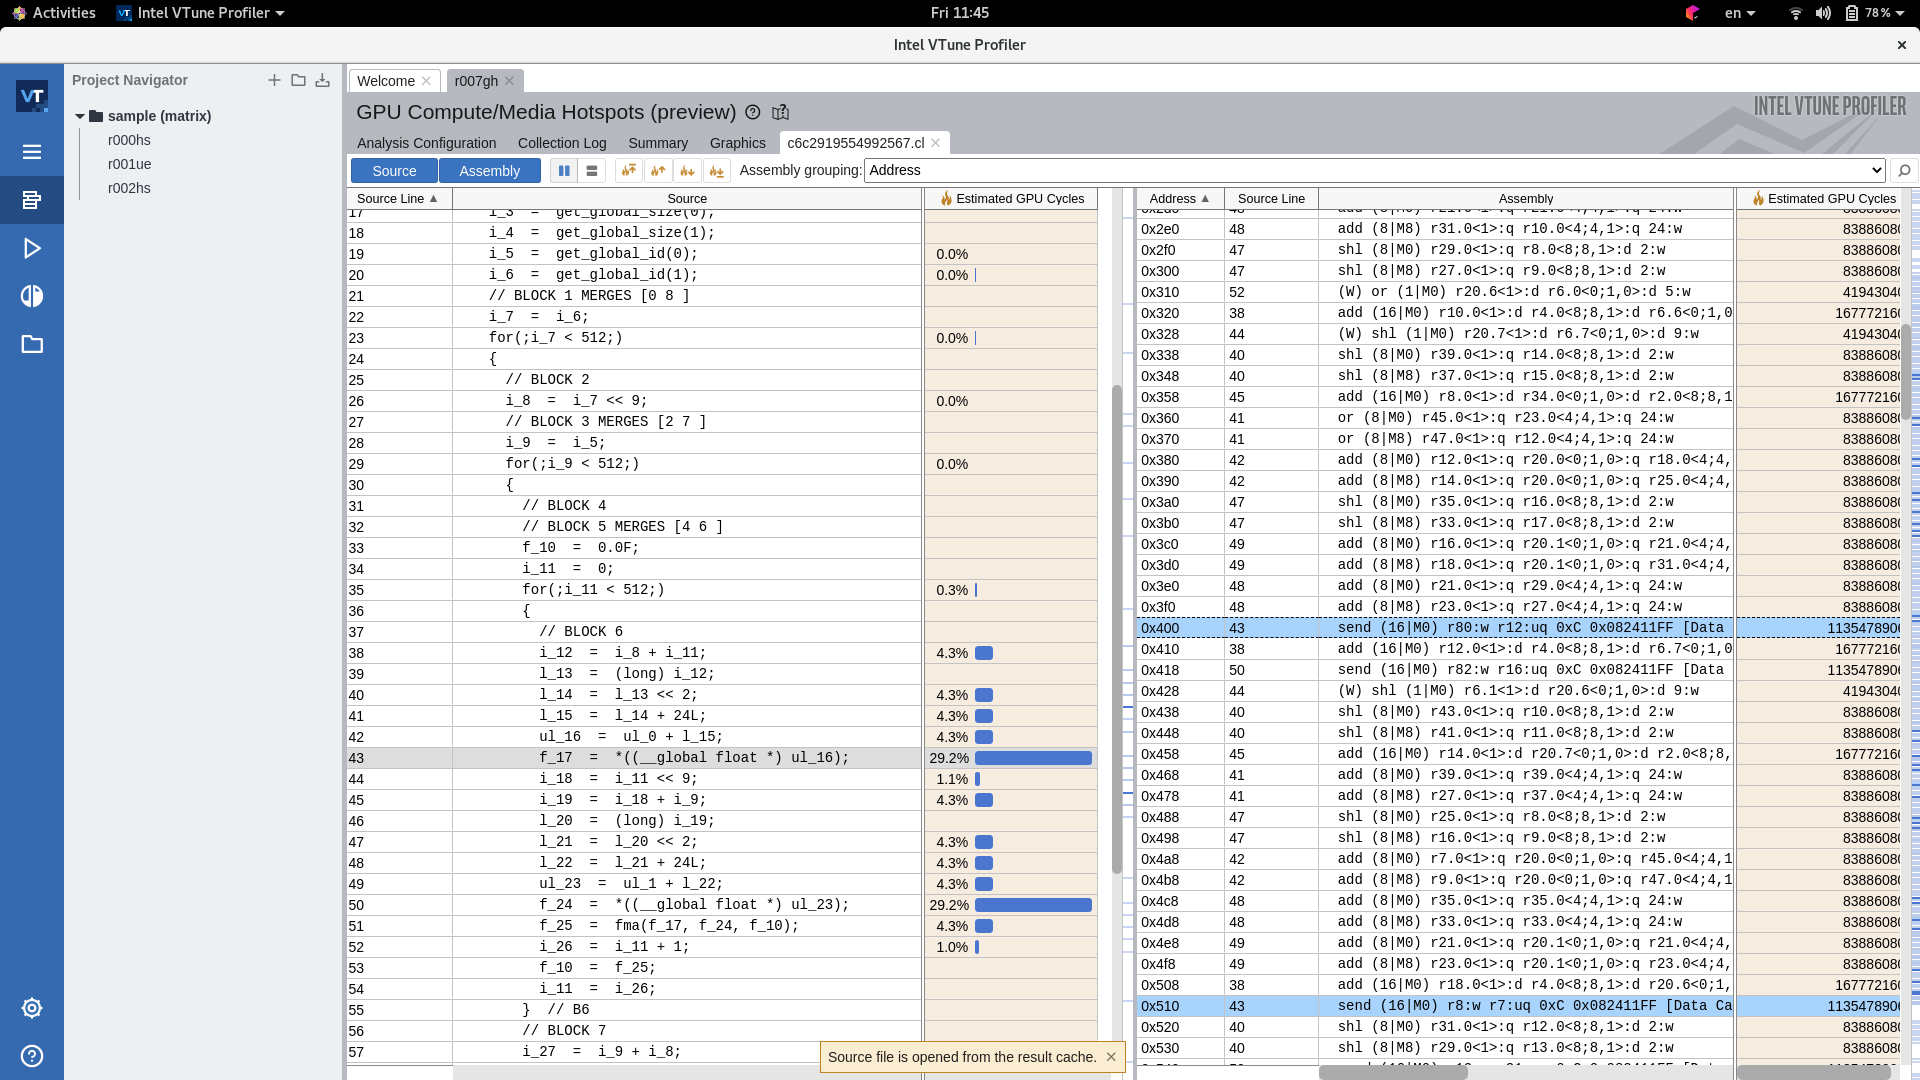
From this profiling trace, we can see that our kernel is taking 29% of the total time performing a read instruction from the GPU’s global memory to an internal register. If we double click on the estimated cycles, VTune will open the GPU assembly code that corresponds to the targeted line of OpenCL C code:

We can see on the right-hand side of the image that VTune highlights the instruction of interest from the left-hand side. In this case, we see that the assembly instruction “SEND” takes ~30% for the read from global to private memory of the GPU and 30% from the private memory to the global memory.
Conclusions
VTune is a powerful tool to profile and analyze hotspots not only for CPU execution but also for GPU kernels running on the Intel HD Graphics. VTune provides a command-line interface that can be used to generate profiling information offline. Then, we can visualize the results of the profiled hotspots using the GUI of VTune. With this tool, we can also inspect an estimated number of cycles per statement in the source code as well as the GPU assembly code that the Intel OpenCL and Level Zero drivers generate.
Discussions
For discussions, feel free to add your comments and feedback on GitHub.
Acks
I want to thank Steve Dohrmann from Intel for his support and guidelines to run TornadoVM with VTune. I also want to thank Christos Kotselidis and Athanasios Stratikopulos from The University of Manchester for the constructive feedback on this post.